Daily Market Outlook, March 03, 2020
The US market staged a comeback rally on Monday on growing optimism that global central banks would ease monetary policies to counter Covid-19 economic fallout.
The Dow Jones added 1,293 pts or 5.1% in what appears to be its largest daily point gain in history, while the S&P 500 and NASDAQ rose 4.6% and 4.5%, partially retracing last week’s more-than-10% sell-off that was triggered by fear over the virus’ rapid spread.
ECB President Christine Lagarde said that the ECB is ready to take "appropriate and targeted measures" to fight the economic impact Covid-19. This came after Fed chair Jerome Powell pledged last week that the Fed will use its tools and act appropriate to support the economy.
Treasury yields were little changed 10Y UST yield closed slightly higher at 1.16% but still at historical low, signalling ongoing risk aversion. Gold price gained a little to $1589.44/barrel. Crude oil rebounded by 2.7-4.5% on expectation of deeper OPEC cut.
RBA rate decision which saw a 25bp rate cut in line with market pricing. Price action was complicated ahead of the decision by comments from PM Morrison who noted that the government and RBA were “highly aligned” on policy responses to the coronavirus.
Overnight headlines on Reuters note that the G7 statement as of now does not include specific language calling for fresh fiscal spending or co-ordinated interest rate cuts by central banks has, and could continue to pour cold water on optimism seen Monday
US manufacturing sector felt Covid-19 impact: The ISM Manufacturing Index came in lower at 50.1 in February (Jan: 50.9), a result of new orders contraction and slower gain in production (-4pts) and exports orders as US manufacturers began to feel the impact of Covid-19 outbreak that has disrupted the global supply chain. Most industry panels cited the virus as the main source of concerns, with ISM concluding that “Global supply chains are impacting most, if not all, of the manufacturing industry sectors' '. Notably the prices paid index slumped way below 50 (45.9 vs 53.3) to suggest a huge loss in inflationary pressure this month. Separately, the Markit Manufacturing PMI slipped to 50.7 in the same month (Jan: 51.9), adding to sign of the slowdown.
US construction spending surged in Jan: Construction spending growth accelerated to1.8% MOM in January (Dec: +0.2% revised) after an upwardly December revision, driven by the spending on both residential and nonresidential work as homebuilders are raising inventories to meet higher demand in a housing sector that is getting vibrant.
UK manufacturing recovered after Brexit: UK Markit PMI bucked global trend and picked up to 51.7 in February (Jan: 50) mainly because domestic demand recovered on the back of reduced Brexit uncertainty after the country’s formal withdrawal from the EU in late January. That said, the impact of Covid-19 had on the supply chain was nonetheless felt by the industry judging from the drop in supply delivery time.
Eurozone manufacturing PMI remained below 50: The Eurozone Manufacturing PMI rose to 49.2 in February (Jan: 47.9), but still in contraction territory, reflecting continuous decline in new orders and output albeit at slower paces. Average lead time rose sharply to indicate a constrained supply chain, again attributing to the Covid-19 outbreak in China.
Caixin China manufacturing PMI plunged to record low: Caixin Manufacturing PMI fell to a record low of 40.3 in February (Jan: 51.1), reflecting the impact of measures being put in place such as travel restriction to contain the spread of Covid-19.
Japan manufacturing PMI slipped further on poor demand: Japan Markit PMI dropped to 47.8 in February (Jan: 48.8) as firms cut production in response to deteriorating demand, particularly from China. The Covid-19 outbreak has also severely disrupted supply chain preventing Chinese raw materials from being shipped into Japan.
Today’s Options Expiries for 10AM New York Cut (notable size in bold)
- EURUSD: 1.1065 (EUR447mn); 1.1080 (EUR577mn); 1.1105 (EUR435mn); 1.1200 (EUR377mn)
- USDJPY: 107.00 (USD311mn); 108.00 (USD445mn); 108.20 (USD430mn); 108.40 (USD770mn); 109.00 (USD876mn); 109.25 (USD350mn); 110.00 (USD630mn)
- GBPUSD: 1.2800 (GBP415mn); 1.2850 (GBP233mn)
- AUDUSD: 0.6600 (AUD330mn)
Technical & Trade Views
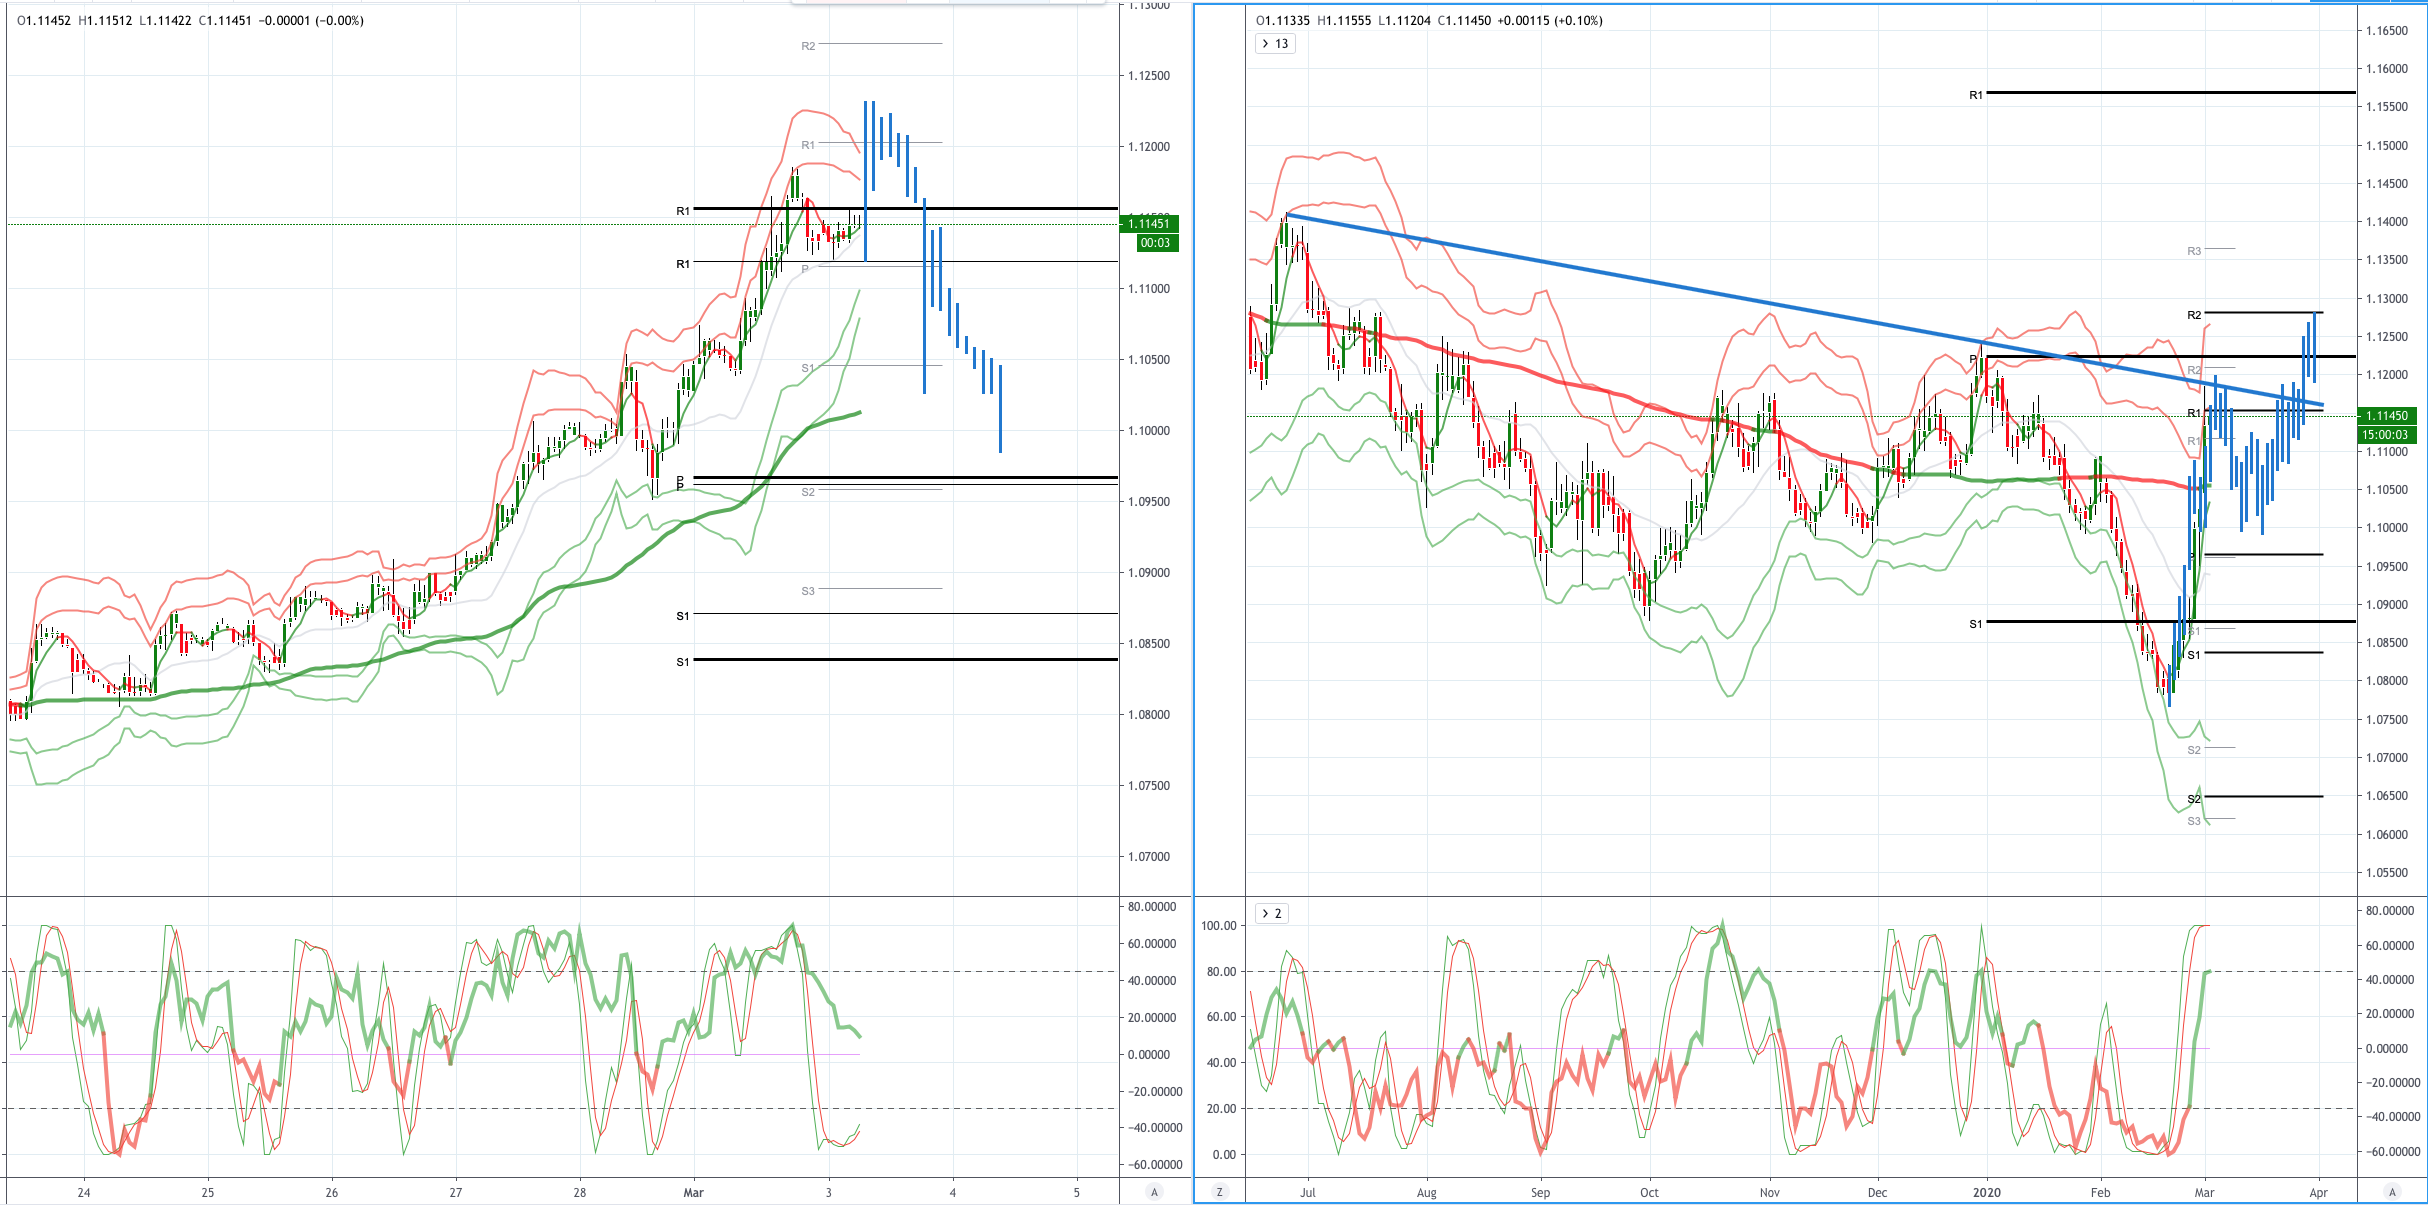
EURUSD (Intraday bias: Bullish above 1.11 neutral below)
EURUSD From a technical and trading perspective, month end short covering has driven prices higher as shorts are squeezed, on the day look for a test of offers 1.1120/60 to cap the first leg higher, before we may see a pullback to test bids towards 1.0960, if this area finds support then we could set a base targeting an equidistant swing pattern later in the week. A failure below 1.0940 would be a bearish development suggesting yet another failed upside attempt. UPDATE as highlighted in the Weekly Market Outlook scale and scope of short squeeze similar to price action seen in August 2018, suggesting a test of offers and stops above 1.12 before a correction back to test bids towards 1.10
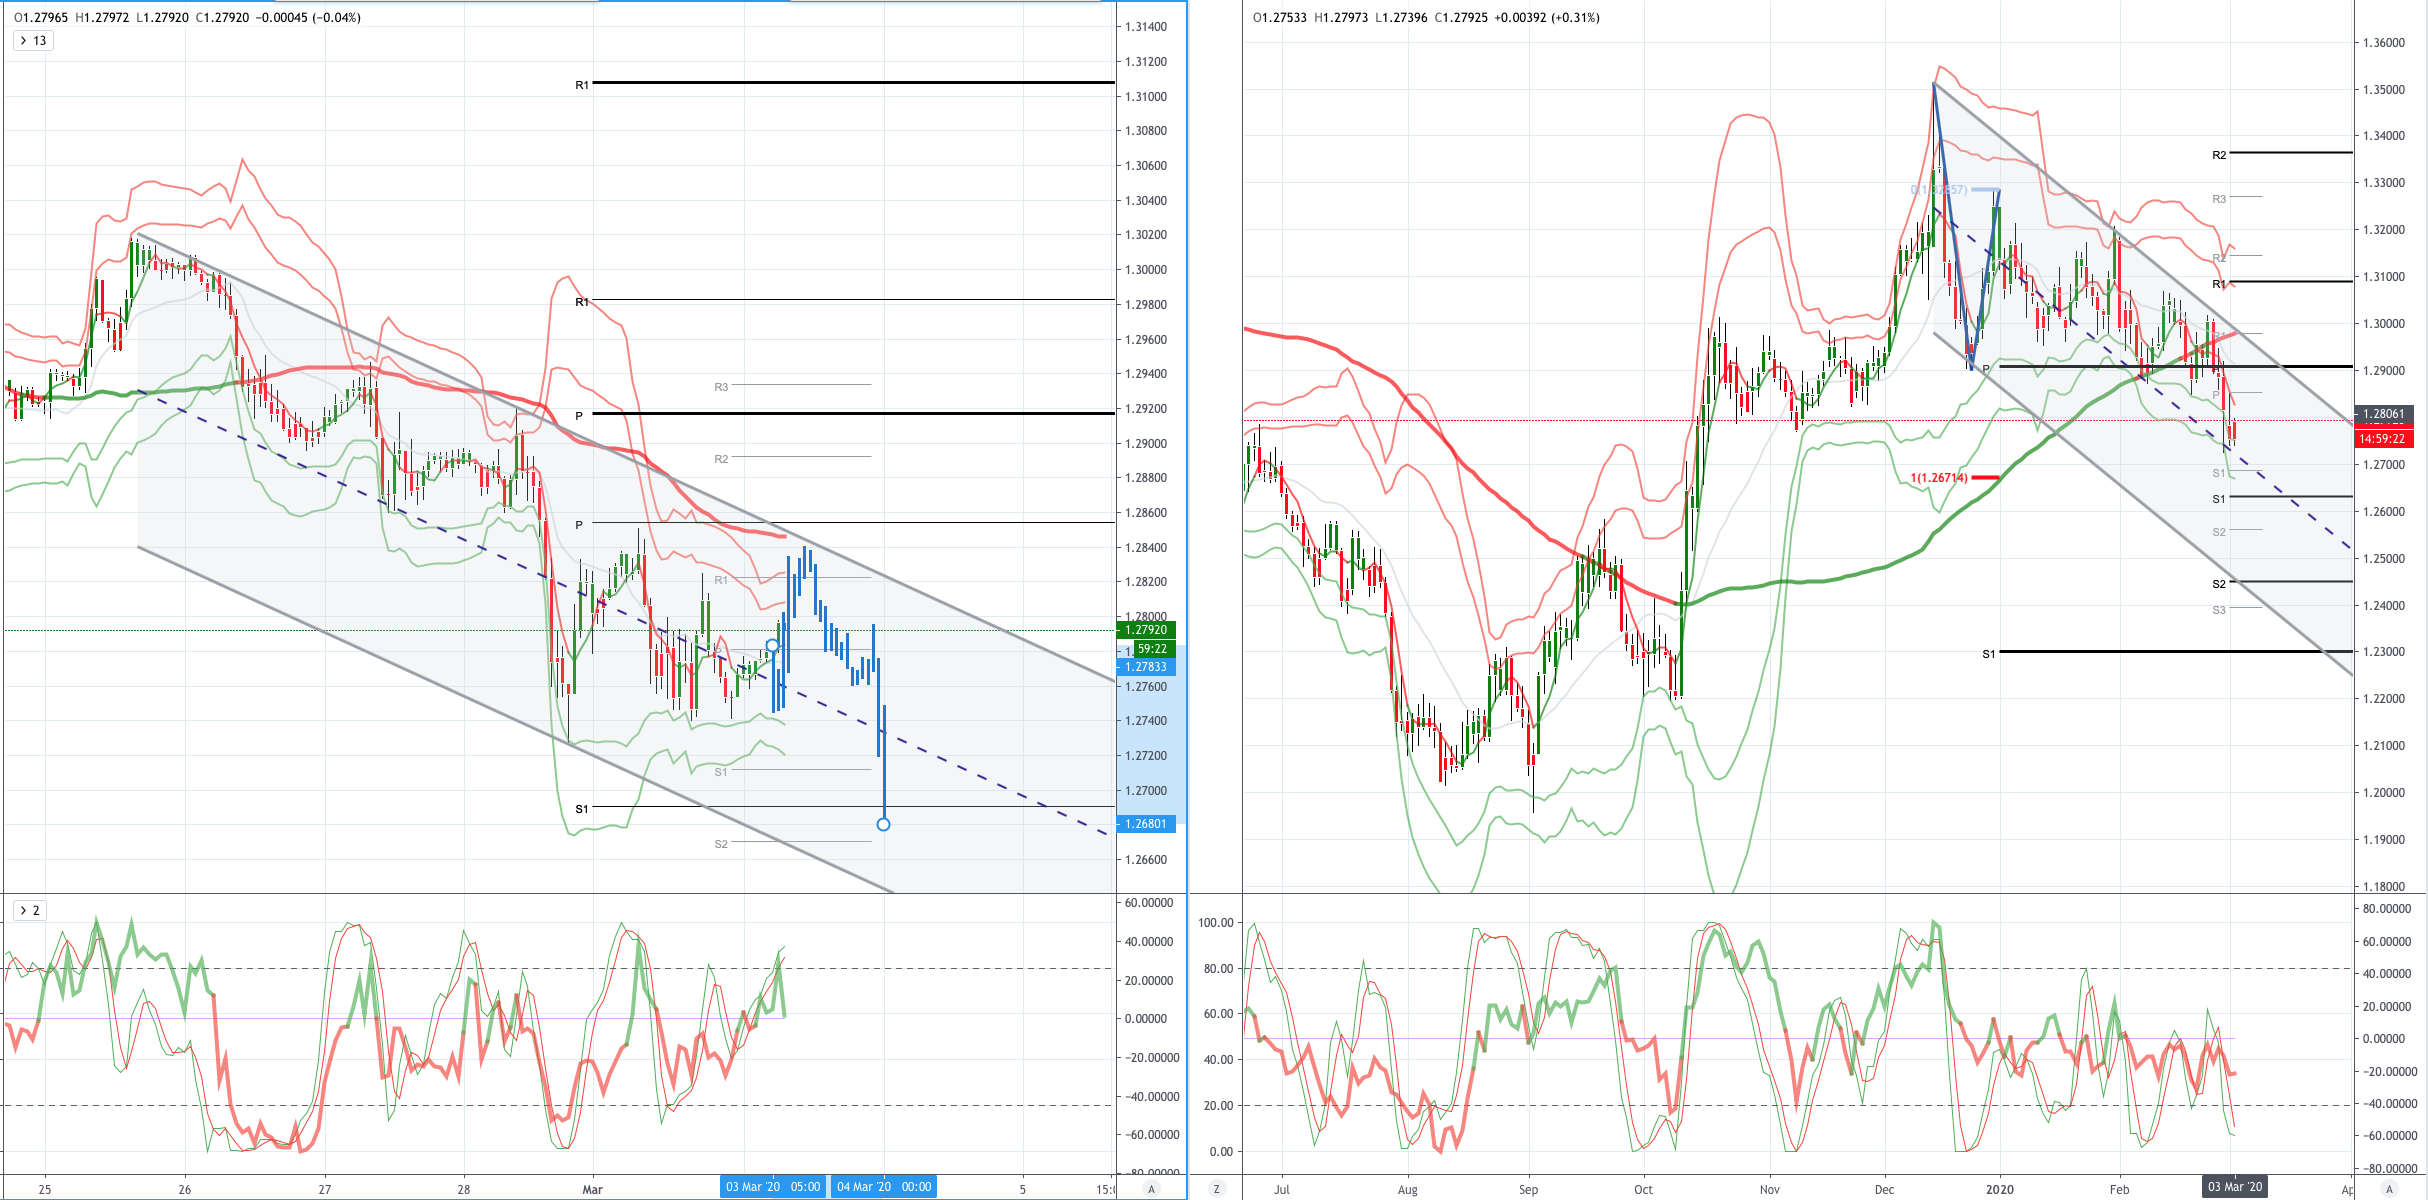
GBPUSD (Intraday bias: Bearish below 1.2860 Bullish above)
GBPUSD From a technical and trading perspective, as 1.2860 caps corrections look for a test of the equidistant swing objective sighted at 1.2670, on the day only a close above 1.29 would stabilise prices and delay further downside
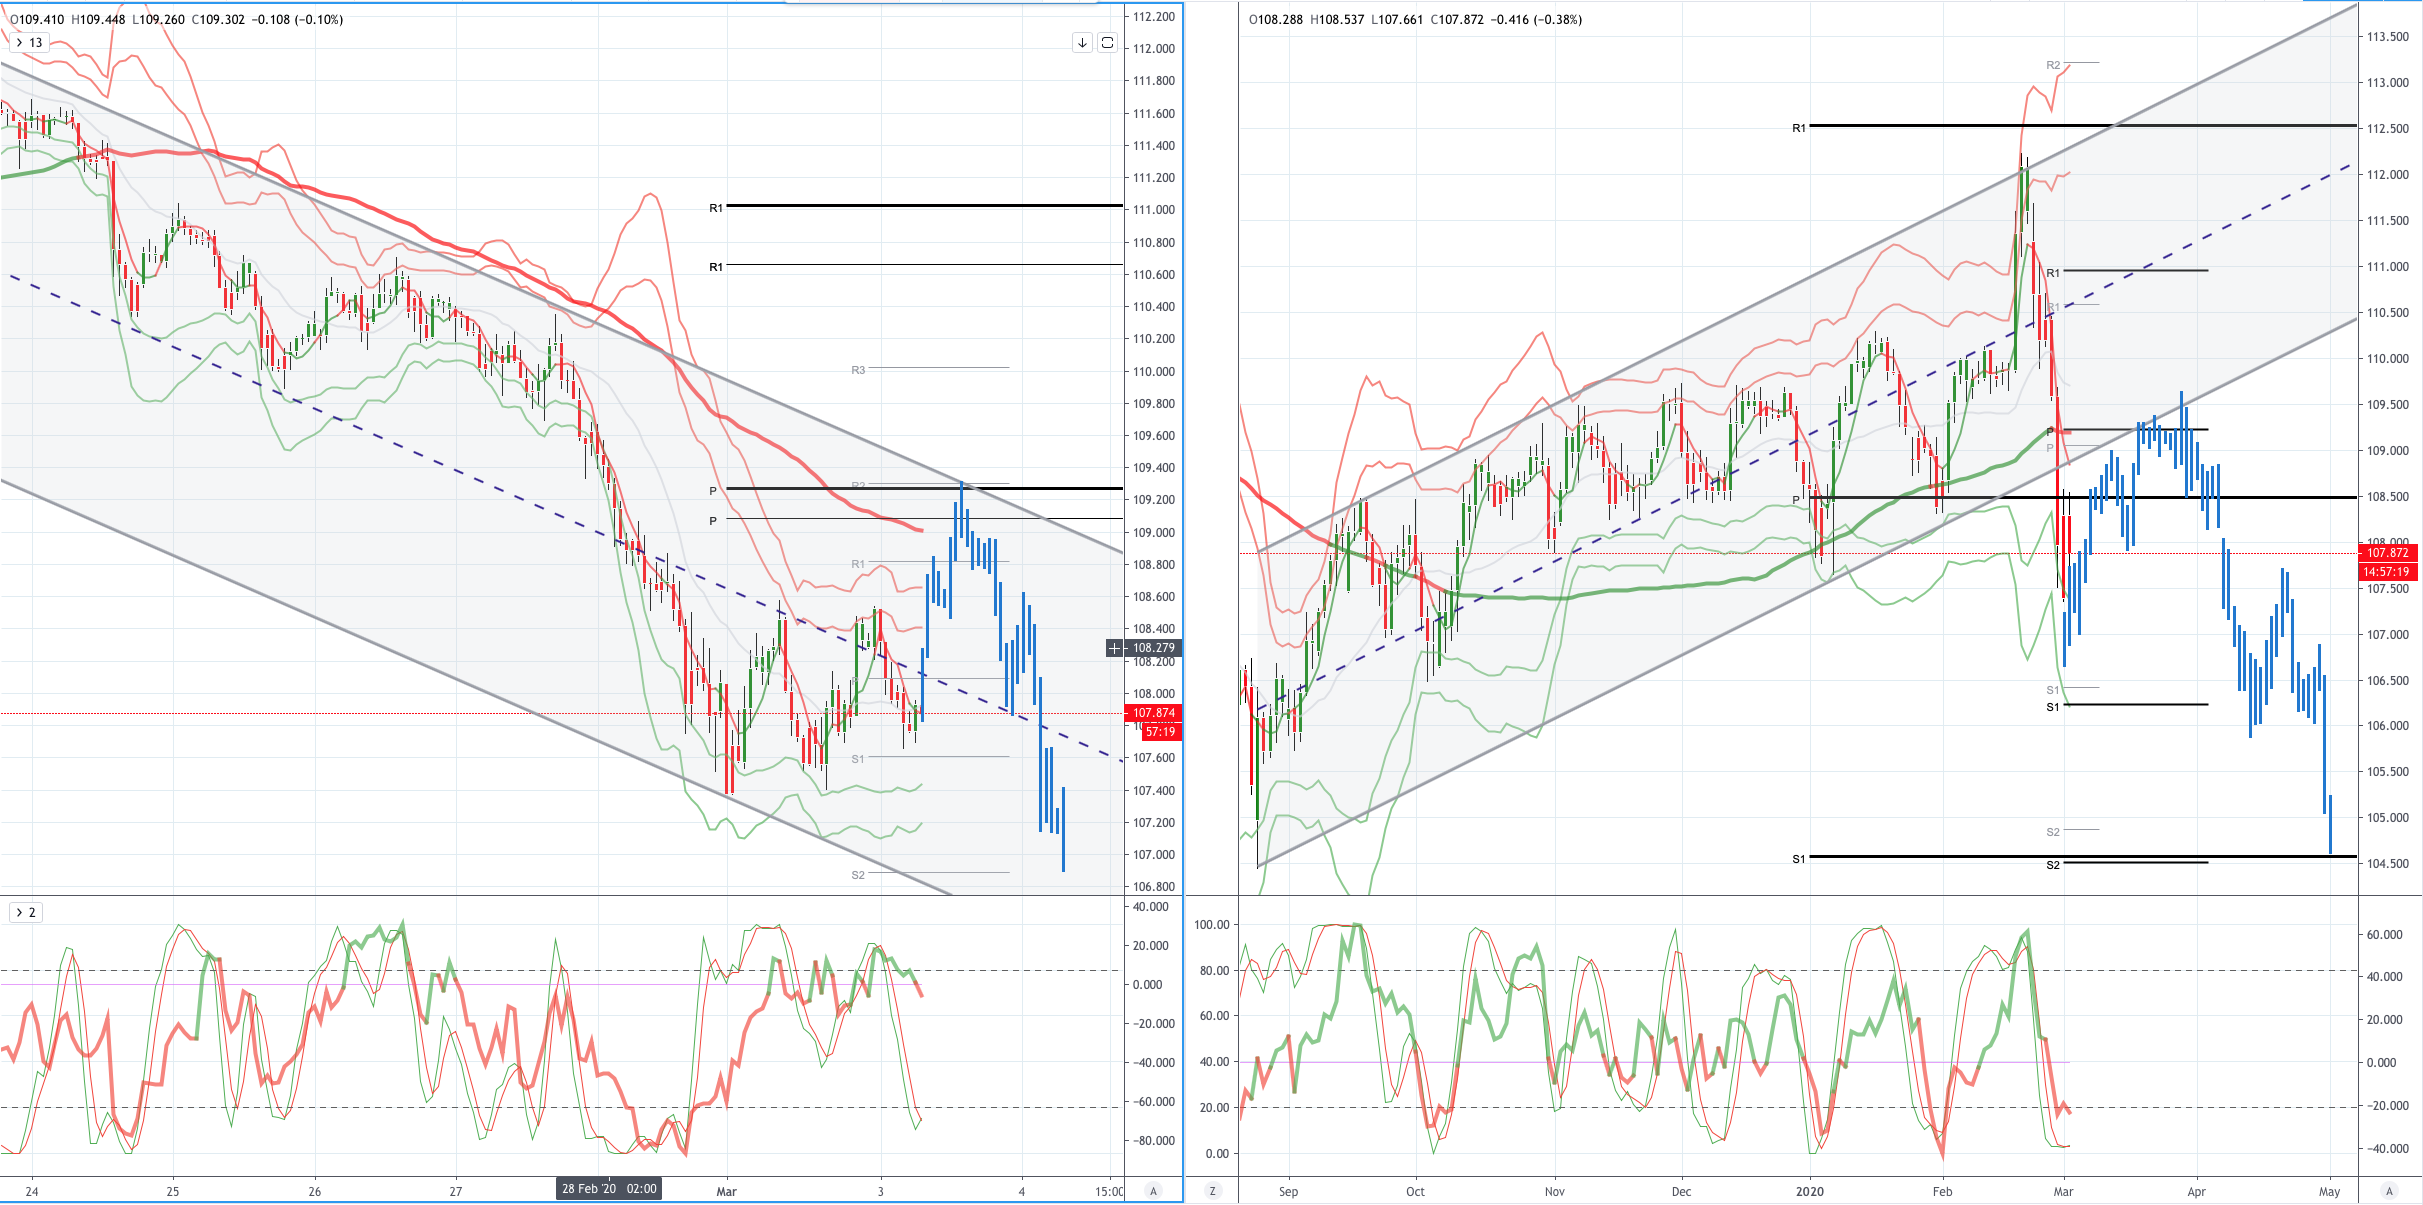
USDJPY (intraday bias: Bearish below 109.20 Bullish above)
USDJPY From a technical and trading perspective, prices sliced through the pivotal test of daily ascending trendline support and duly exposed bids and stops to 107.50, as 109.20 caps upside attempts bears look for a 106.50 test next, on the day only a close above 109.60 would delay further downside
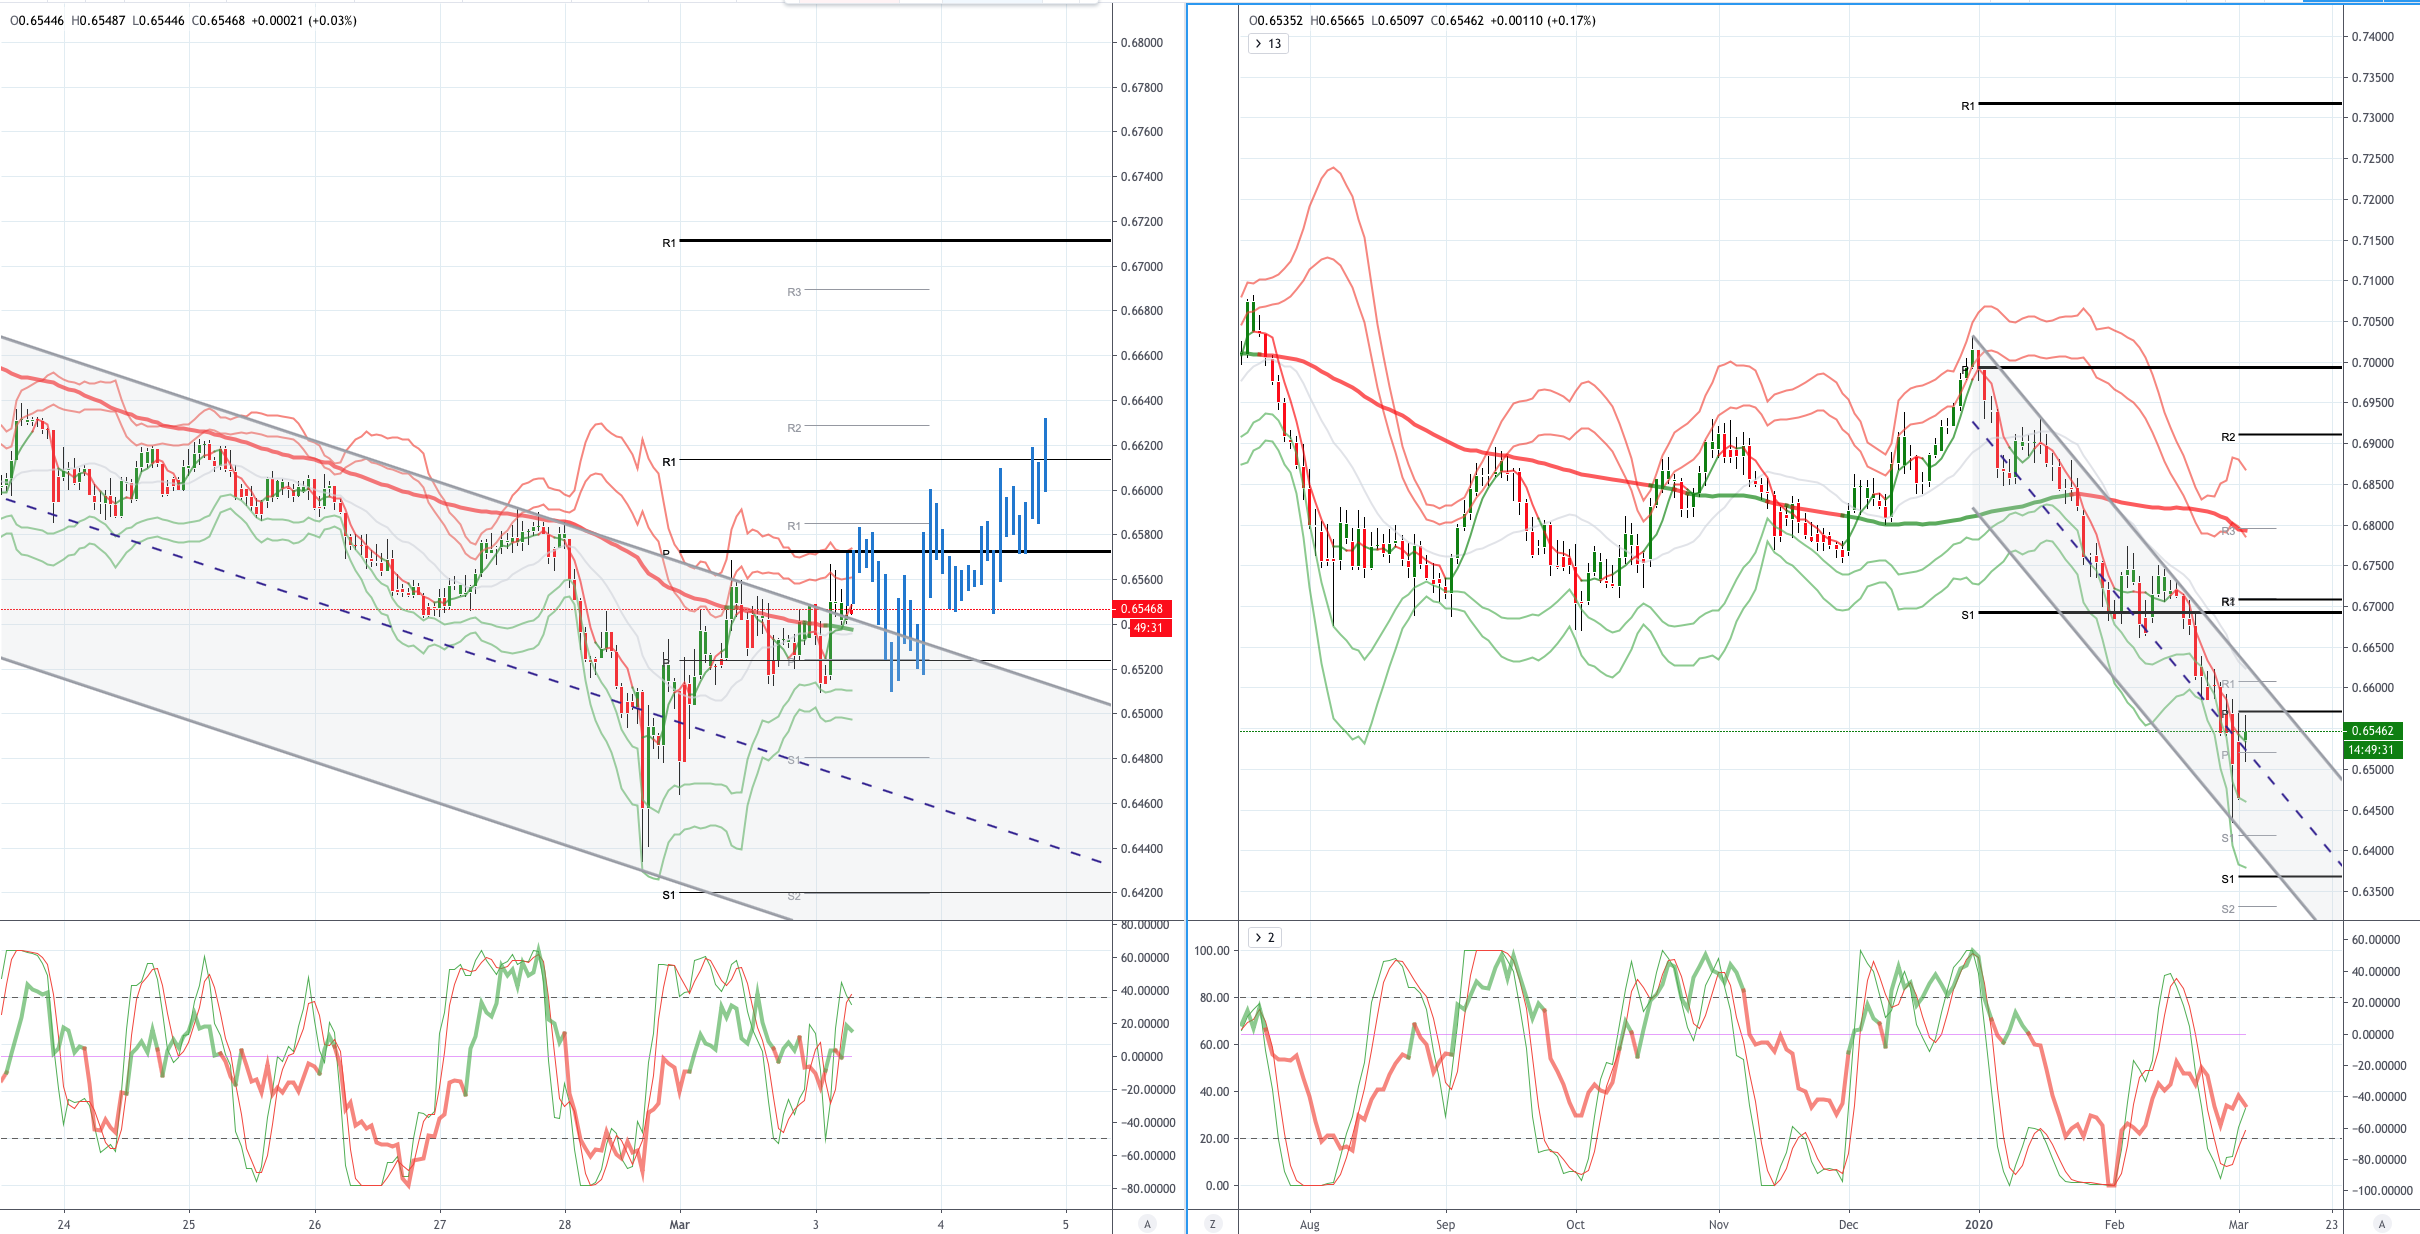
AUDUSD (Intraday bias: Bearish below .6600 Bullish above)
AUDUSD From a technical and trading perspective the spike below .6500 has attracted bids early in the week a close back through the .6600 handle would suggest the potential for a more sustained correction targeting .6700. A failure to carve out a meaningful low here will open .6350 downside test next
Disclaimer: The material provided is for information purposes only and should not be considered as investment advice. The views, information, or opinions expressed in the text belong solely to the author, and not to the author’s employer, organization, committee or other group or individual or company.
High Risk Warning: CFDs are complex instruments and come with a high risk of losing money rapidly due to leverage. 73% and 70% of retail investor accounts lose money when trading CFDs with Tickmill UK Ltd and Tickmill Europe Ltd respectively. You should consider whether you understand how CFDs work and whether you can afford to take the high risk of losing your money.
Disclaimer: The material provided is for information purposes only and should not be considered as investment advice. The views, information, or opinions expressed in the text belong solely to the author, and not to the author’s employer, organization, committee or other group or individual or company.
Past performance is not indicative of future results.
High Risk Warning: CFDs are complex instruments and come with a high risk of losing money rapidly due to leverage. 69% and 73% of retail investor accounts lose money when trading CFDs with Tickmill UK Ltd and Tickmill Europe Ltd respectively. You should consider whether you understand how CFDs work and whether you can afford to take the high risk of losing your money.
Futures and Options: Trading futures and options on margin carries a high degree of risk and may result in losses exceeding your initial investment. These products are not suitable for all investors. Ensure you fully understand the risks and take appropriate care to manage your risk.
Patrick has been involved in the financial markets for well over a decade as a self-educated professional trader and money manager. Flitting between the roles of market commentator, analyst and mentor, Patrick has improved the technical skills and psychological stance of literally hundreds of traders – coaching them to become savvy market operators!