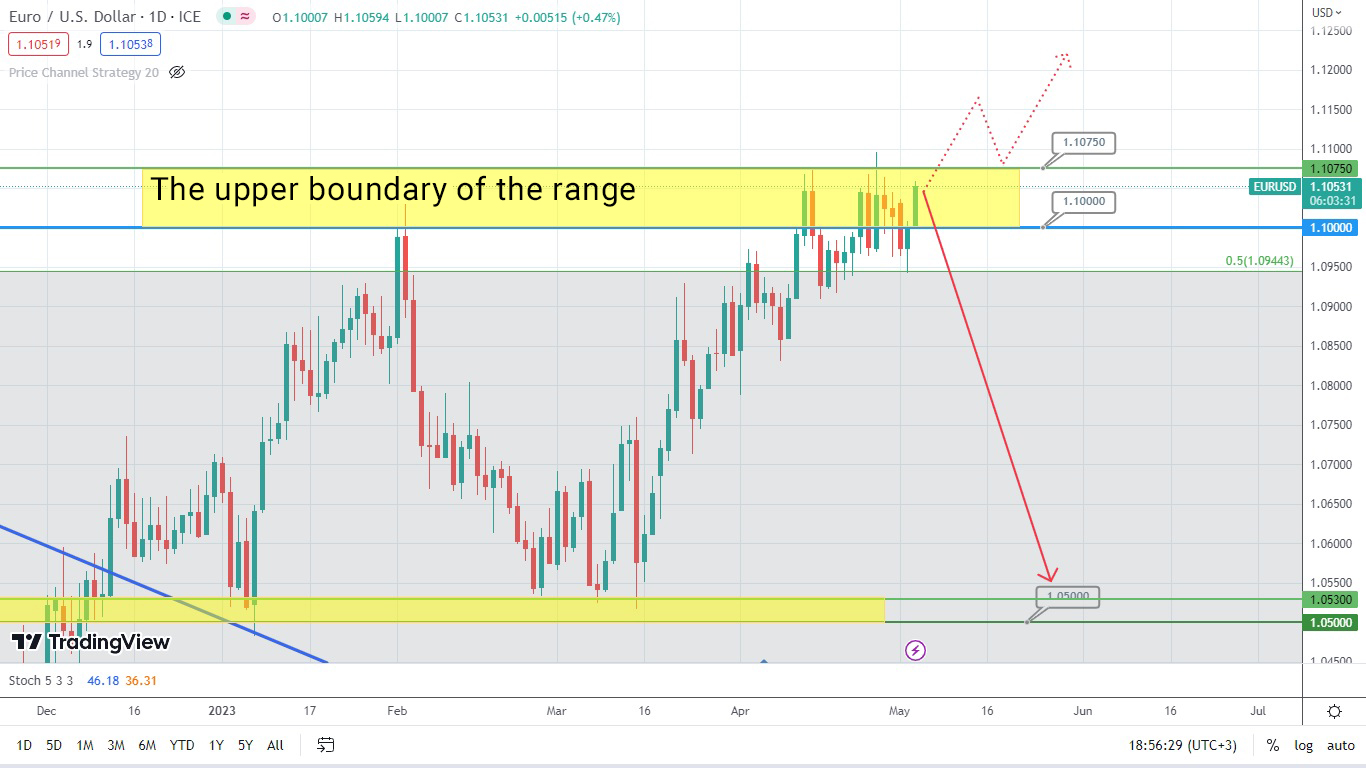
EUR/USD is at a Critical Crossroads: What’s Next?

The price of the currency pair EUR/USD keeps moving within the resistance area formed between the levels 1.1000 and 1.1075. Let’s observe when the asset price will exit this zone and make the next move.
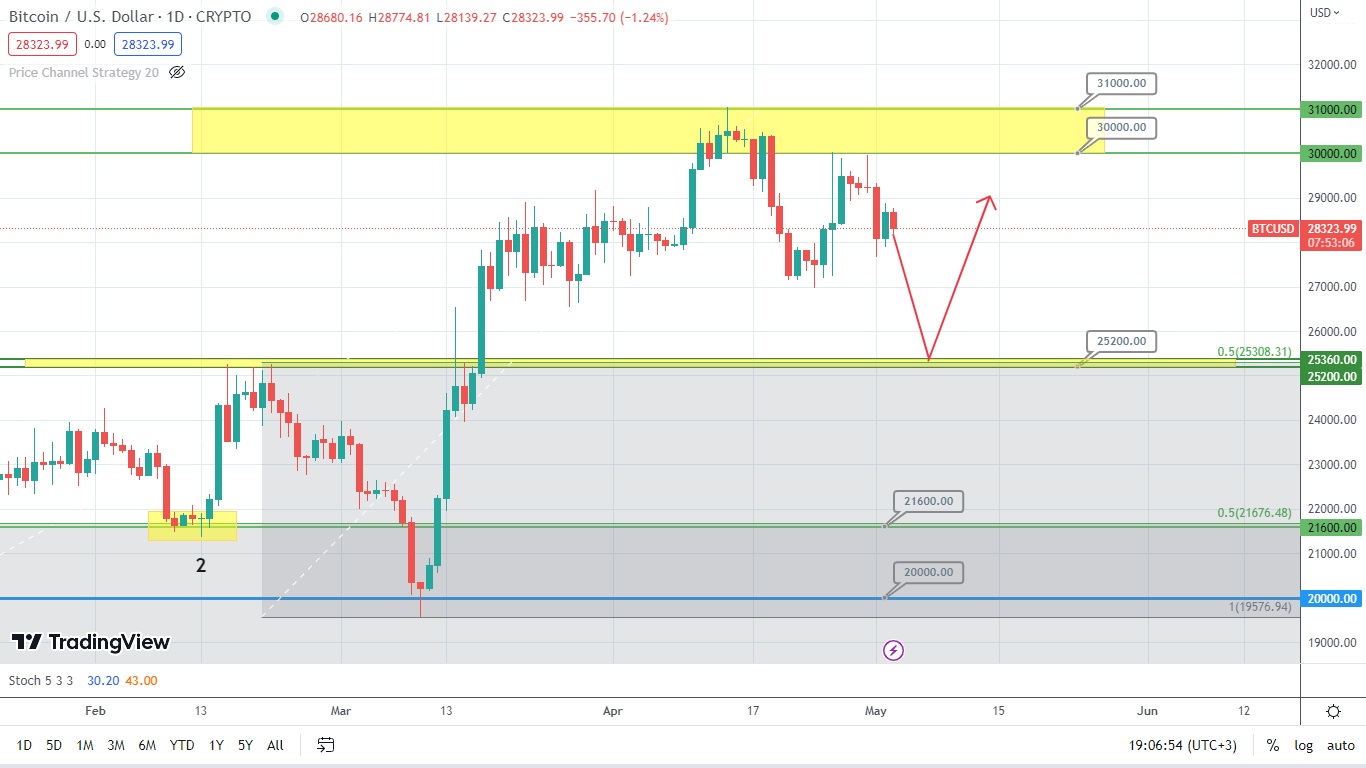
Bitcoin is undergoing correction towards the supporting level of 25200. It would be interesting to follow the price movements around this level. Although it looks like Bitcoin might potentially jump.
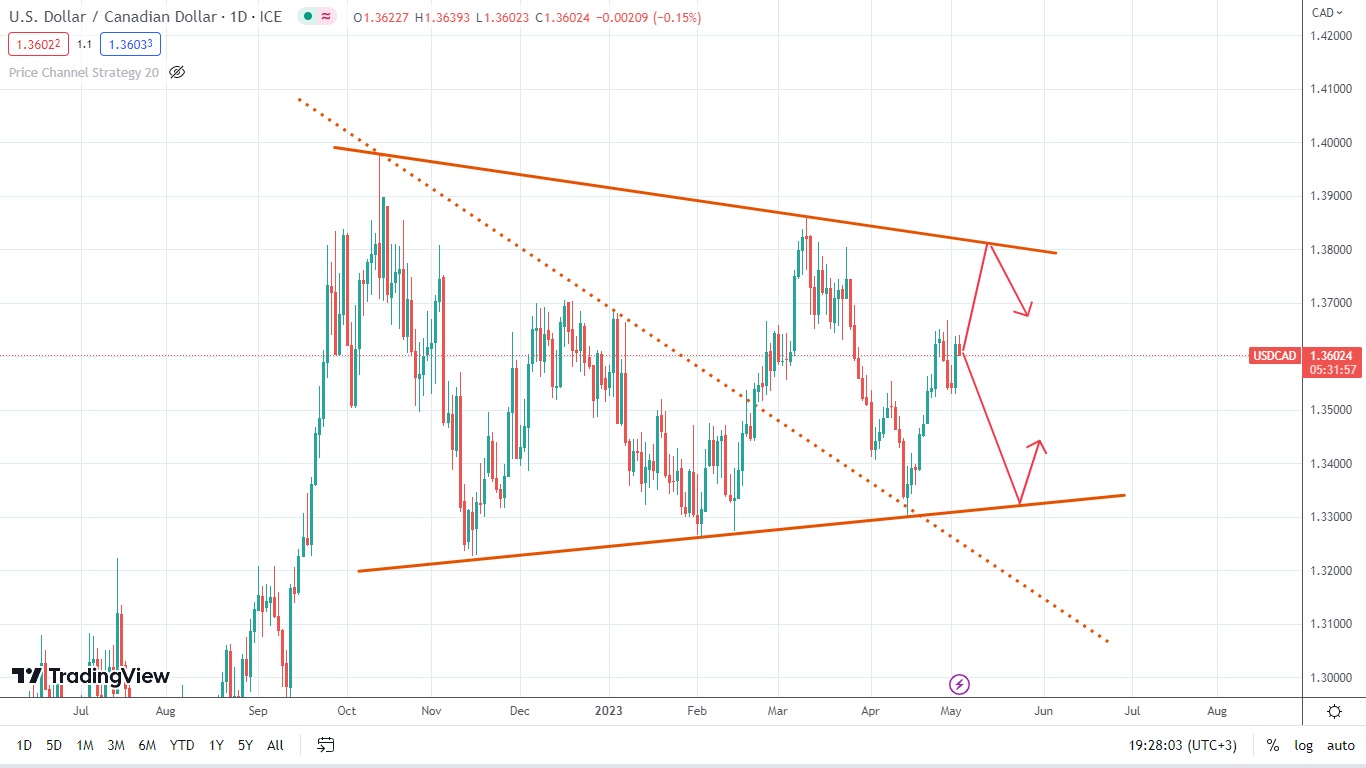
The Canadian dollar has formed a symmetrical triangle on the daily chart. Currently, the asset’s price is in the middle of this triangle. Hence, it would be wise to observe whether the asset’s price will rebound from the triangle sides inside of the pattern.
Disclaimer: The material provided is for information purposes only and should not be considered as investment advice. The views, information, or opinions expressed in the text belong solely to the author, and not to the author’s employer, organization, committee or other group or individual or company.
Past performance is not indicative of future results.
High Risk Warning: CFDs are complex instruments and come with a high risk of losing money rapidly due to leverage. 69% and 73% of retail investor accounts lose money when trading CFDs with Tickmill UK Ltd and Tickmill Europe Ltd respectively. You should consider whether you understand how CFDs work and whether you can afford to take the high risk of losing your money.
Futures and Options: Trading futures and options on margin carries a high degree of risk and may result in losses exceeding your initial investment. These products are not suitable for all investors. Ensure you fully understand the risks and take appropriate care to manage your risk.