Institutional Insights: BofA Systematic Flow Monitor

The model predicts that CTAs will buy oil next week. WTI crude oil futures have risen this week as tensions between Israel and Iran persist. Our model indicates that short- and medium-term trend followers are quickly increasing their long positions, while long-term models are either exiting or covering their shorts. We expect trend strength across models to rise in the coming week, leading to more buying activity. Additionally, Soybean and Soybean Oil futures have also increased, driven by new regulations favoring US biofuels over imports (refer to our report, Global Agriculture Strategist: June 18, 2025). Trend followers are already holding long positions in Soybeans and Soybean Oil, with further buying anticipated next week. Conversely, our model shows that CTAs still have short positions in Soybean Meal. In other commodities, trend followers maintain long positions in Gold and copper while being short on Aluminum, with a possibility of covering some Aluminum shorts next week.
In terms of CTA equity and bond positioning, there is a variance depending on the model. Trend follower positions in US equities continue to be mixed based on model strategy, with a long position in EURO STOXX 50 being the consensus among the tracked indices. Slower models may cover short positions in the Russell 2000 significantly next week. In fixed income, CTAs hold small short positions in 10Y Treasury futures, and although the positioning in the 30Y futures is mixed, longer-term trend followers might increase their short positions and potentially cover next week. Larger sales of Korean Treasury Bond futures could also occur.
Despite a gain in the US Dollar this week, primarily triggered by the escalation of the Israel-Iran conflict, this increase has not affected the short positioning of trend followers. Our model indicates that CTAs remain in strong consensus, maintaining maximum USD shorts against EUR, GBP, and MXN—still over 1.4% away from unwinding triggers. Positions in JPY, CAD, and AUD are not as extreme, with JPY selling expected against the USD next week.
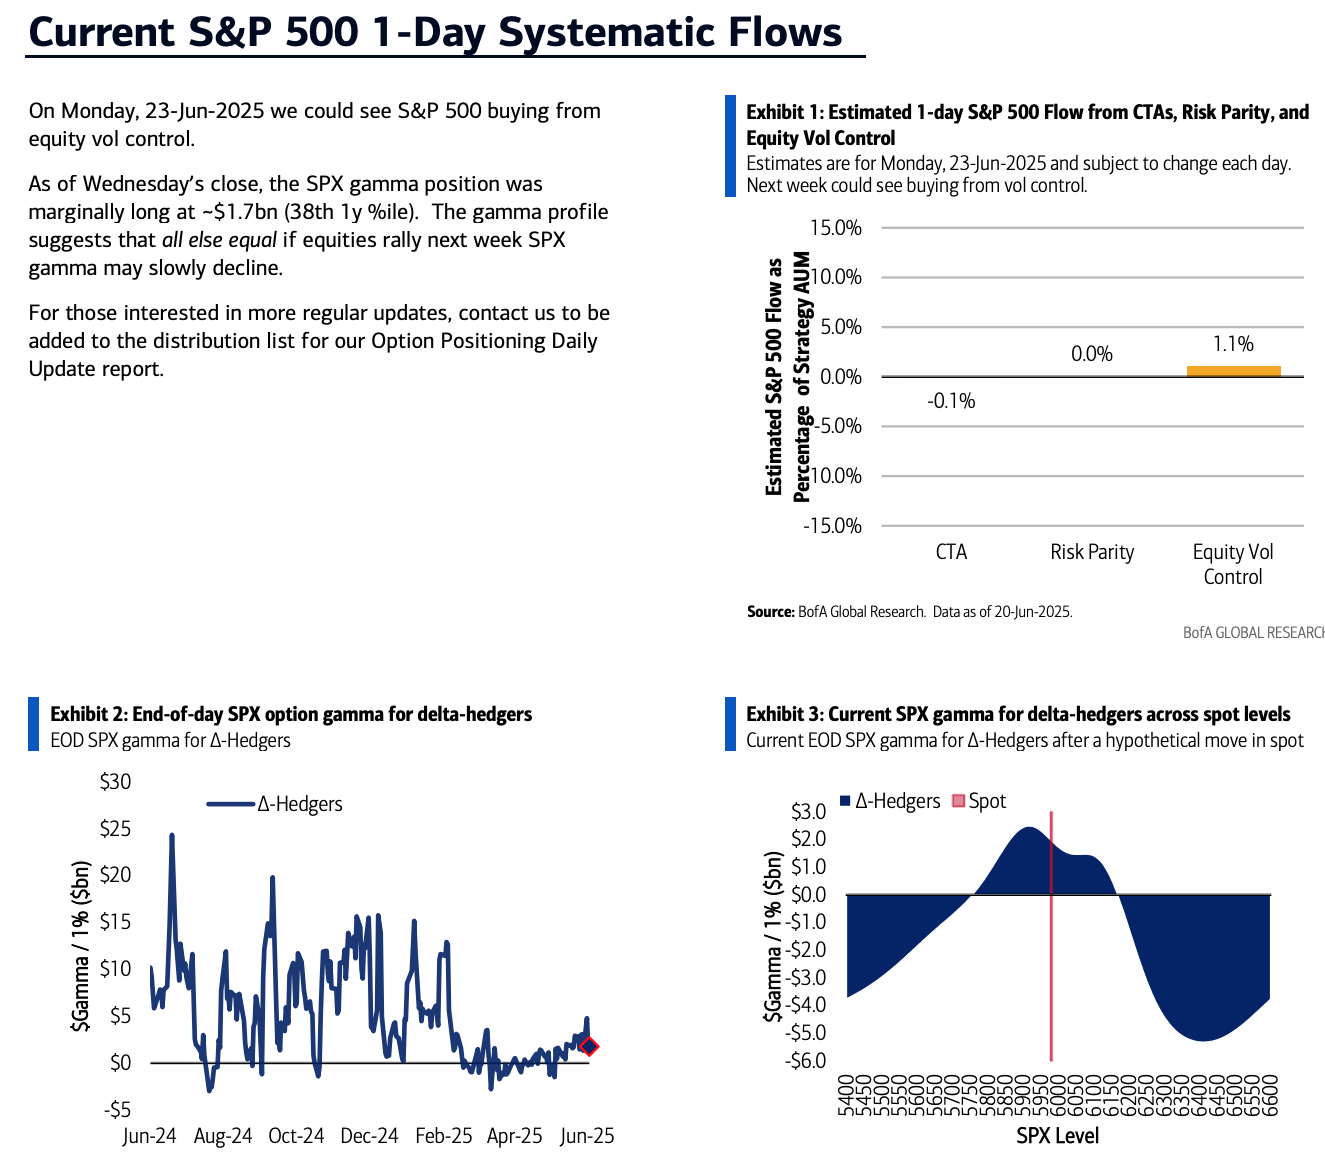
As of Wednesday’s close, the SPX gamma was slightly long at approximately $1.7 billion (38th percentile for the year). The gamma profile implies that if equities rise next week, SPX gamma may gradually decrease. Since equities sold off in late February, the SPX gamma has been in a subdued state, and according to our estimates, the recent drop in S&P realized volatility owing to gamma over the past month is just 0.6 points (4% of its level), a relatively minor figure. Within the VIX complex, end-user VIX delta exposure is significantly high (at the 94th percentile for the year)—more details can be found in our daily option positioning report.
Disclaimer: The material provided is for information purposes only and should not be considered as investment advice. The views, information, or opinions expressed in the text belong solely to the author, and not to the author’s employer, organization, committee or other group or individual or company.
Past performance is not indicative of future results.
High Risk Warning: CFDs are complex instruments and come with a high risk of losing money rapidly due to leverage. 69% and 73% of retail investor accounts lose money when trading CFDs with Tickmill UK Ltd and Tickmill Europe Ltd respectively. You should consider whether you understand how CFDs work and whether you can afford to take the high risk of losing your money.
Futures and Options: Trading futures and options on margin carries a high degree of risk and may result in losses exceeding your initial investment. These products are not suitable for all investors. Ensure you fully understand the risks and take appropriate care to manage your risk.
Patrick has been involved in the financial markets for well over a decade as a self-educated professional trader and money manager. Flitting between the roles of market commentator, analyst and mentor, Patrick has improved the technical skills and psychological stance of literally hundreds of traders – coaching them to become savvy market operators!