- Futures
-
Tickmill Experts
REAL TIME NEWS
Loading...
Title: EURGBP H1 | Bearish breakout Type: Bearish reversal Preference: The price is rising toward the pivot at 0.8569, which is a pullback resistance. A reversal from this level could lead the price toward the 1st support at 0.8547, a pullback support. Alternative...
Title: EURGBP H1 | Bearish breakout Type: Bearish reversal Preference: The price is rising toward the pivot at 0.8569, which is a pullback resistance
UBS CIO View on Gold — Short-Term Caution, Long-Term BullishUBS’s latest gold view is constructive over the medium term but cautious near term. The World Gold Council’s second-quarter data confirm a mixed supply-demand picture: investment and jewelry demand softene...
UBS CIO View on Gold — Short-Term Caution, Long-Term BullishUBS’s latest gold view is constructive over the medium term but cautious near term. The Wo
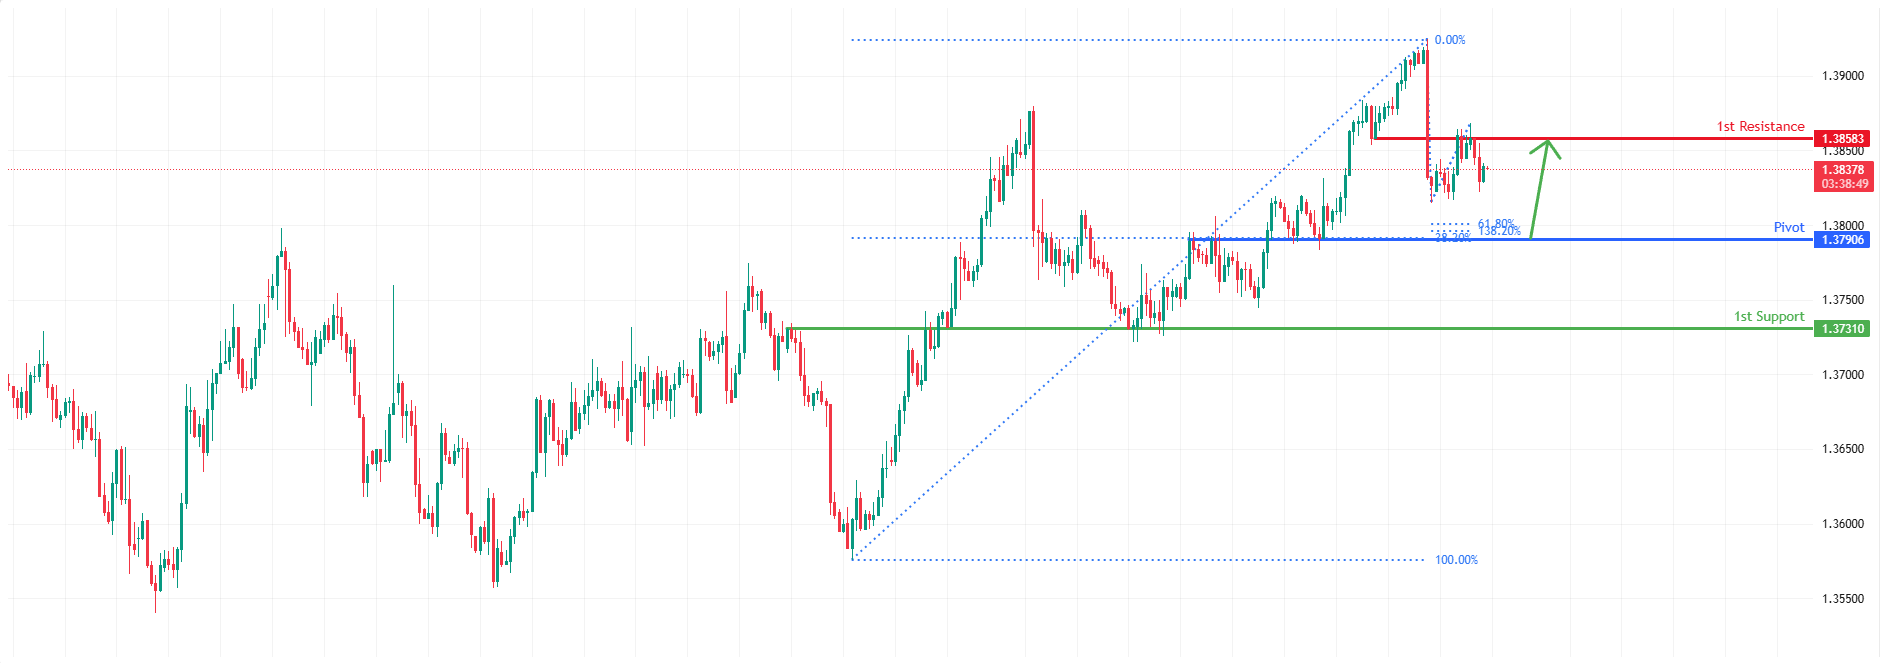
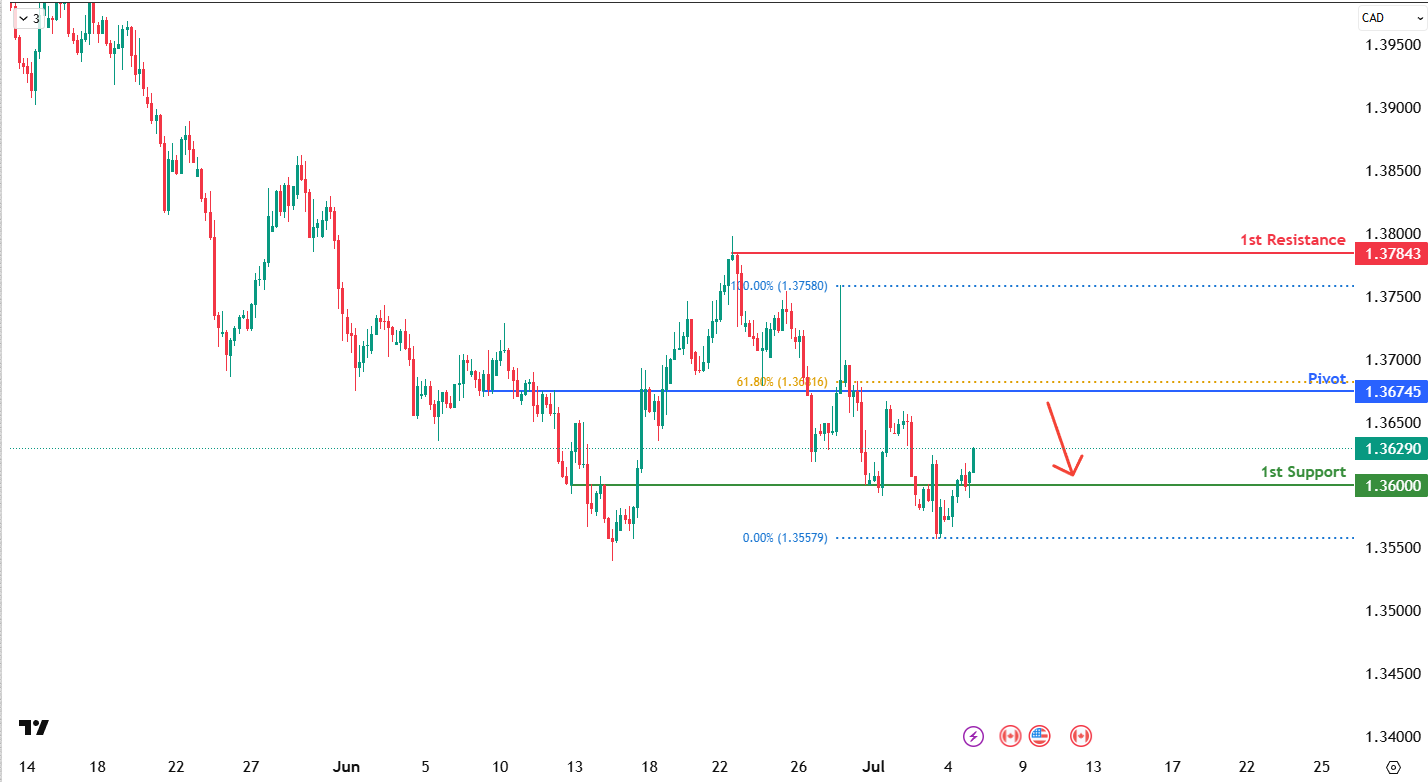
Title: EURCAD H4 | Rising toward key resistance Type: Bearish reversal Preference: The price is rising toward the pivot at 1.61728, an overlap resistance that aligns with the 61.8% Fibonacci retracement. A reversal at this level could lead the price toward the 1st ...
Title: EURCAD H4 | Rising toward key resistance Type: Bearish reversal Preference: The price is rising toward the pivot at 1.61728, an overlap resista
FTSE Finish Line: July 31 — FTSE Hits Third Straight Intraday Record as Miners, Energy and NatWest Cap Strong MonthLondon ended July with another record-setting session, as the FTSE 100 hit an intraday high for the third session in a row and remained on course for ...
FTSE Finish Line: July 31 — FTSE Hits Third Straight Intraday Record as Miners, Energy and NatWest Cap Strong MonthLondon ended July with another reco
JPY ExplodesUSDJPY is on watch today amidst huge volatility in the pair around the BOJ meeting overnight. JPY rallied 600 pips against the Dollar despite the BOJ keeping rates on hold with many clearly suspecting intervention from Japanese authorities. Officials th...
JPY ExplodesUSDJPY is on watch today amidst huge volatility in the pair around the BOJ meeting overnight. JPY rallied 600 pips against the Dollar desp
Title: XAUUSD H1 | Bullish momentum building Type: Bullish bounce Preference: The price is falling toward the pivot at 4,085.71, a pullback support. A bounce from this level could lead the price toward the 1st resistance at 4,159.48, a pullback resistance. Alternat...
Title: XAUUSD H1 | Bullish momentum building Type: Bullish bounce Preference: The price is falling toward the pivot at 4,085.71, a pullback support. A
JPM FX FOMC Post-Mortem — USD Hit by Fed Credibility Risk, but Long-Dollar Trade Not DeadJPM’s FX strategy team argues that Wednesday was a material setback for the dollar, but not enough to abandon the long-USD trade. The FOMC initially had hawkish components — in...
JPM FX FOMC Post-Mortem — USD Hit by Fed Credibility Risk, but Long-Dollar Trade Not DeadJPM’s FX strategy team argues that Wednesday was a material s
Daily Market Outlook, July 31, 2026 Patrick Munnelly, Partner: Market Strategy, Tickmill GroupMunnelly’s Macro Minute — Chips Rip, Yen SlipsMarkets are ending a bruising week with a spectacular relief rally in Asia, but the rebound is more repair than reset. Batter...
Daily Market Outlook, July 31, 2026 Patrick Munnelly, Partner: Market Strategy, Tickmill GroupMunnelly’s Macro Minute — Chips Rip, Yen SlipsMarkets ar
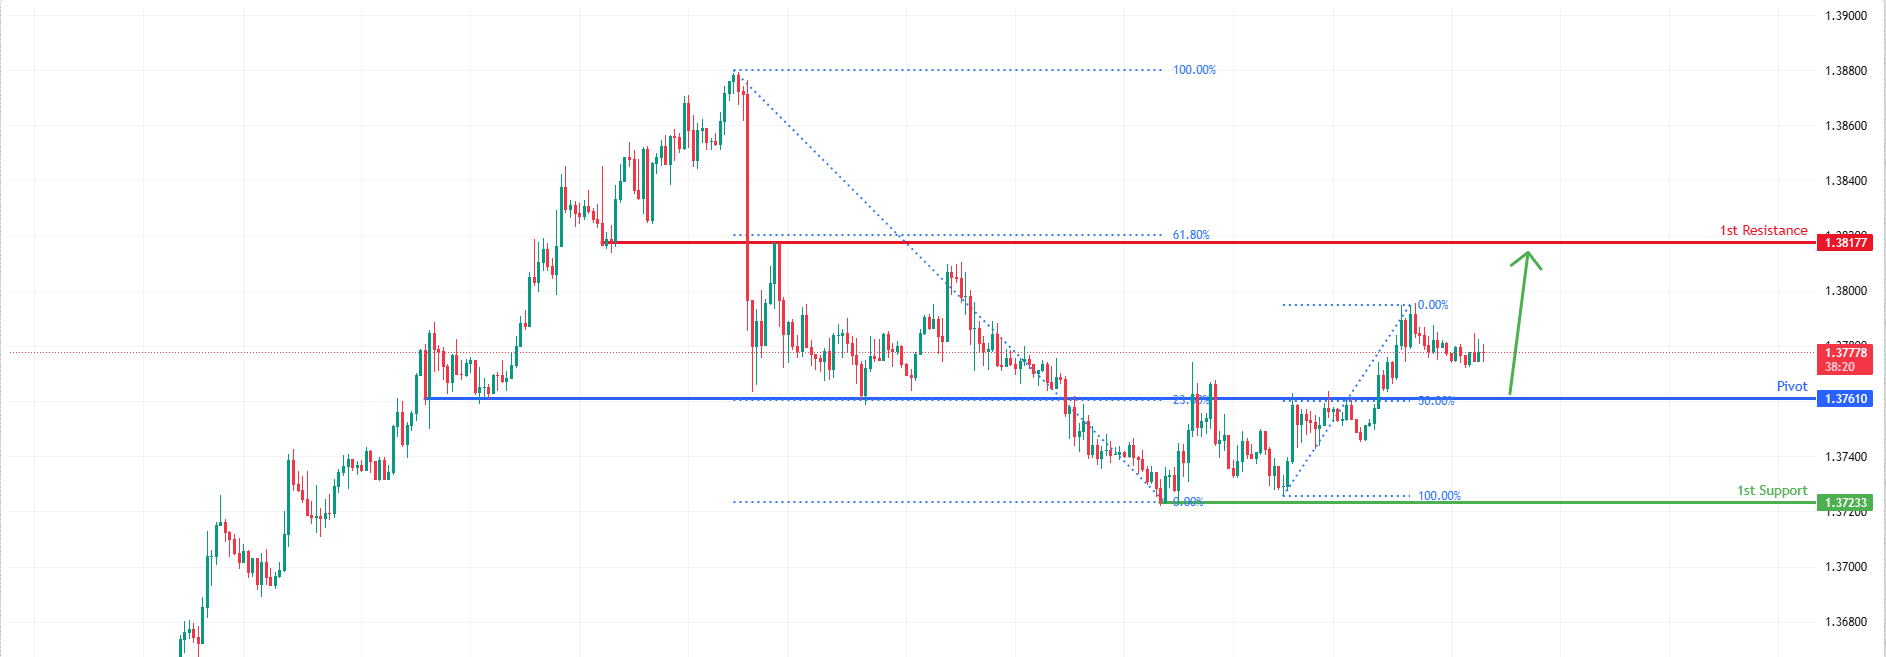
Title: USDCHF H4 | Potential bullish rebound Type: Bullish bounce Preference: The price is falling toward the pivot at 0.8009, an overlap support that aligns with the 50% Fibonacci retracement. A bounce from this level could push the price toward the 1st resistance...
Title: USDCHF H4 | Potential bullish rebound Type: Bullish bounce Preference: The price is falling toward the pivot at 0.8009, an overlap support that
Copper RallyingCopper prices are pushing higher ahead of the weekend with the futures market benefiting from the current bout of USD weakness we’re seeing. The greenback has turned heavily lower on the back of the July FOMC midweek which saw the Fed holding rates s...
Copper RallyingCopper prices are pushing higher ahead of the weekend with the futures market benefiting from the current bout of USD weakness we’re se