Institutional Insights: UBS Sales & Trading Update 12/11/26

UBS TECHNICAL STRATEGY BRIEFING: SEMICONDUCTOR UPSIDE BACK IN PLAY & SIX CROSS-ASSET DEMARK SIGNALS
Technical setups across major global indices and cross-asset benchmarks point toward an extended risk-on recovery. The Philadelphia Semiconductor Index (SOX) has confirmed a major bounce off 9,047 DeMark support, aligning with constructive daily and weekly wave counts. Given the structural weight of semiconductor constituents across both the S&P 500 and Nasdaq, this hardware recovery keeps the S&P 500 firmly on track for Perl's 2027 target of 8,485.
Across macro assets, technical exhaustion signals argue against chasing recent defensive or hawkish counter-trend moves:
US Treasury Yields: Recent bounces in 2-Year and 10-Year yields are corrective rallies within broader topping structures, with pending weekly and monthly TD signals pointing toward lower yields.
Volatility (
VIX&MOVE): Recent volatility spikes remain counter-trend bounces inside a longer-term downward regime; breaks below key downside triggers will accelerate equity and credit relief.FX & Commodities:
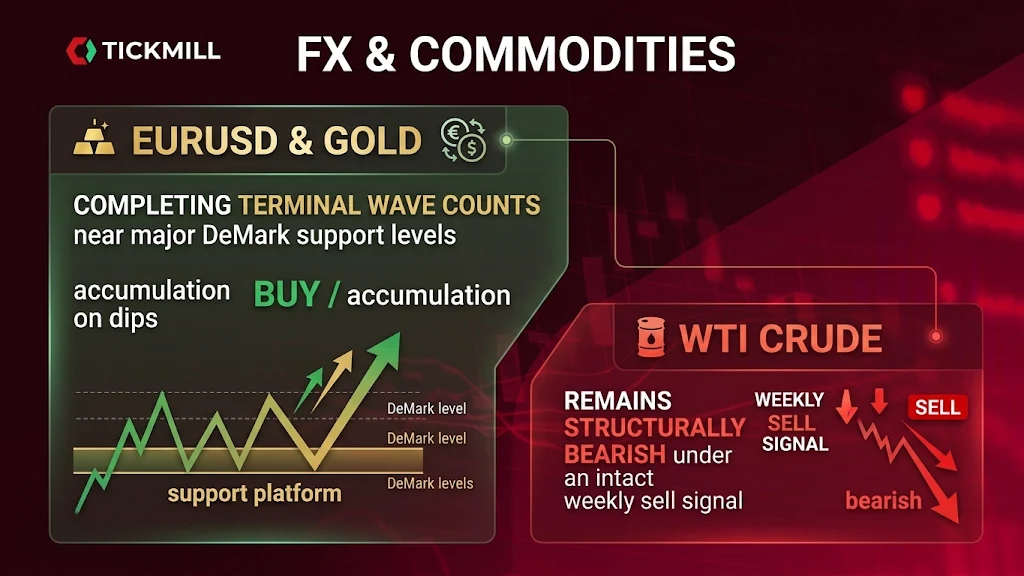
EURUSDand Gold are completing terminal wave counts near major DeMark support levels (favoring accumulation on dips), whileWTI Cruderemains structurally bearish under an intact weekly sell signal.
THE SIX CORE TECHNICAL SIGNALS
1. Semiconductors (
SOX) Set to Extend Recovery:Support & Wave Alignment: Rebounded cleanly off 9,047 DeMark support, coinciding with bullish DeMark Wave 2 (daily) and Wave 4 (weekly) counts.
Breadth & Combo Triggers: 70% of SOX constituents are currently at or near a DeMark Buy signal. Additionally, the daily TD Combo indicator stands at an 11 Count (meaning any renewed near-term dip will trigger a completed Buy signal).
Upside Resistance Targets: Clearing 10,498 unlocks sequential technical targets at 10,878, 11,711, and 12,756.
2. Don’t Chase the Rebound in US Yields:
US 2-Year Yield: Despite Tuesday's sharp post-CPI jump, the weekly TD Combo signal for lower yield remains pending. Any push to fresh highs would trigger a completed TD Combo 13 (the first since September 22, 2023 at 5.1097%).
Resistance: 4.7672%, 4.8737%, 4.9576%
Support: 4.6385%, 4.5098%, 4.3897%, 4.2542%
US 10-Year Nominal Yield: Pulled back following the October 5 daily TD Sequential 9-13-9 top at 5.3046% and currently sits in daily DeMark Wave 4. Tuesday's rally is corrective ahead of a likely monthly TD Sequential 9-13-9 sell signal (for lower yield) at the November 30 month-end close.
Resistance: 5.0612%, 5.1867%, 5.3121%, 5.3624%
Support: 4.8807%, 4.7427%, 4.6460%
3.
VIXandMOVEGains Likely to Fade:Recent jumps in equity (
VIX) and Treasury (MOVE) implied volatility are corrective bounces within a multi-month downtrend. Volatility is unlikely to sustain an elevated regime until the indices record their first monthly closes below 12.44 (VIX) and 59.20 (MOVE).Near-term breakdown triggers sit at 16.57 for VIX and 85.98 for MOVE; breaching these levels will fuel the next leg of the cross-asset rally.
4. Don’t Chase
EURUSDDownside:Both daily (completing Wave 5 or C) and weekly (completing Wave C) charts show terminal downside exhaustion, reinforced by a TD Combo 10 Count approaching a Buy signal. Selling into current dollar strength carries poor risk-reward.
5. Gold & Miners Pullbacks are Buying Opportunities:
Spot Gold: Daily chart is completing Wave 5 or C while the weekly chart finishes Wave C directly at 3,870.74 TD Propulsion support. Pushing back above 4,148.50 confirms the next upward leg.
Gold Miners (
XAUIndex): Basing constructively and poised for daily Wave 3 higher; the July 17 TD Combo Buy signal from 295.80 remains active alongside a bullish monthly Wave 3 count.
6. European Equities (
Euro Stoxx 50) & Sector Rotation:Broad Index: The Euro Stoxx 50 weekly TD Buy Setup from 6,131 remains intact, underpinning a broader European recovery.
Sector Inflections: European Technology has completed Wave C and entered the early stages of a Wave 1 advance, while European Retail has accelerated into Wave 3.
ADDITIONAL CROSS-ASSET & REGIONAL THEMES
WTI Crude (
CL1) — Bearish: The weekly TD Sequential Sell signal from 103.27 (October 23) remains active as price transitions from Wave 5 into corrective Wave A; rallies should be faded.South Korea (
KOSPI) — Bullish Recovery: Daily chart is poised for Wave 1 higher as the weekly chart completes Wave 4 (within a monthly Wave 3 uptrend), supported by the active October 15 TD Sequential Buy from 5,554.Japan (
Nikkei 225) — Cautious: Has satisfied minimum technical requirements to complete Wave C, but requires reclaiming 62,315 to neutralize immediate downside risk.India (
NIFTY) — Constructive: Completed weekly Wave C at 22,421 (October 4) and is advancing in Wave 1; pullbacks represent accumulation opportunities targeting new highs above 26,430 in 2027.US Sector Extensions: Technical momentum favors extended recoveries across US Consumer Discretionary, REITs, Real Estate, Homebuilders, and Airlines.
Disclaimer: The material provided is for information purposes only and should not be considered as investment advice. The views, information, or opinions expressed in the text belong solely to the author, and not to the author’s employer, organization, committee or other group or individual or company.
Past performance is not indicative of future results.
High Risk Warning: CFDs are complex instruments and come with a high risk of losing money rapidly due to leverage. 68% and 74% of retail investor accounts lose money when trading CFDs with Tickmill UK Ltd and Tickmill Europe Ltd respectively. You should consider whether you understand how CFDs work and whether you can afford to take the high risk of losing your money.
Futures and Options: Trading futures and options on margin carries a high degree of risk and may result in losses exceeding your initial investment. These products are not suitable for all investors. Ensure you fully understand the risks and take appropriate care to manage your risk.
Patrick has been involved in the financial markets for well over a decade as a self-educated professional trader and money manager. Flitting between the roles of market commentator, analyst and mentor, Patrick has improved the technical skills and psychological stance of literally hundreds of traders – coaching them to become savvy market operators!