S&P500 Daily Action Areas & Price Targets 12/8/26

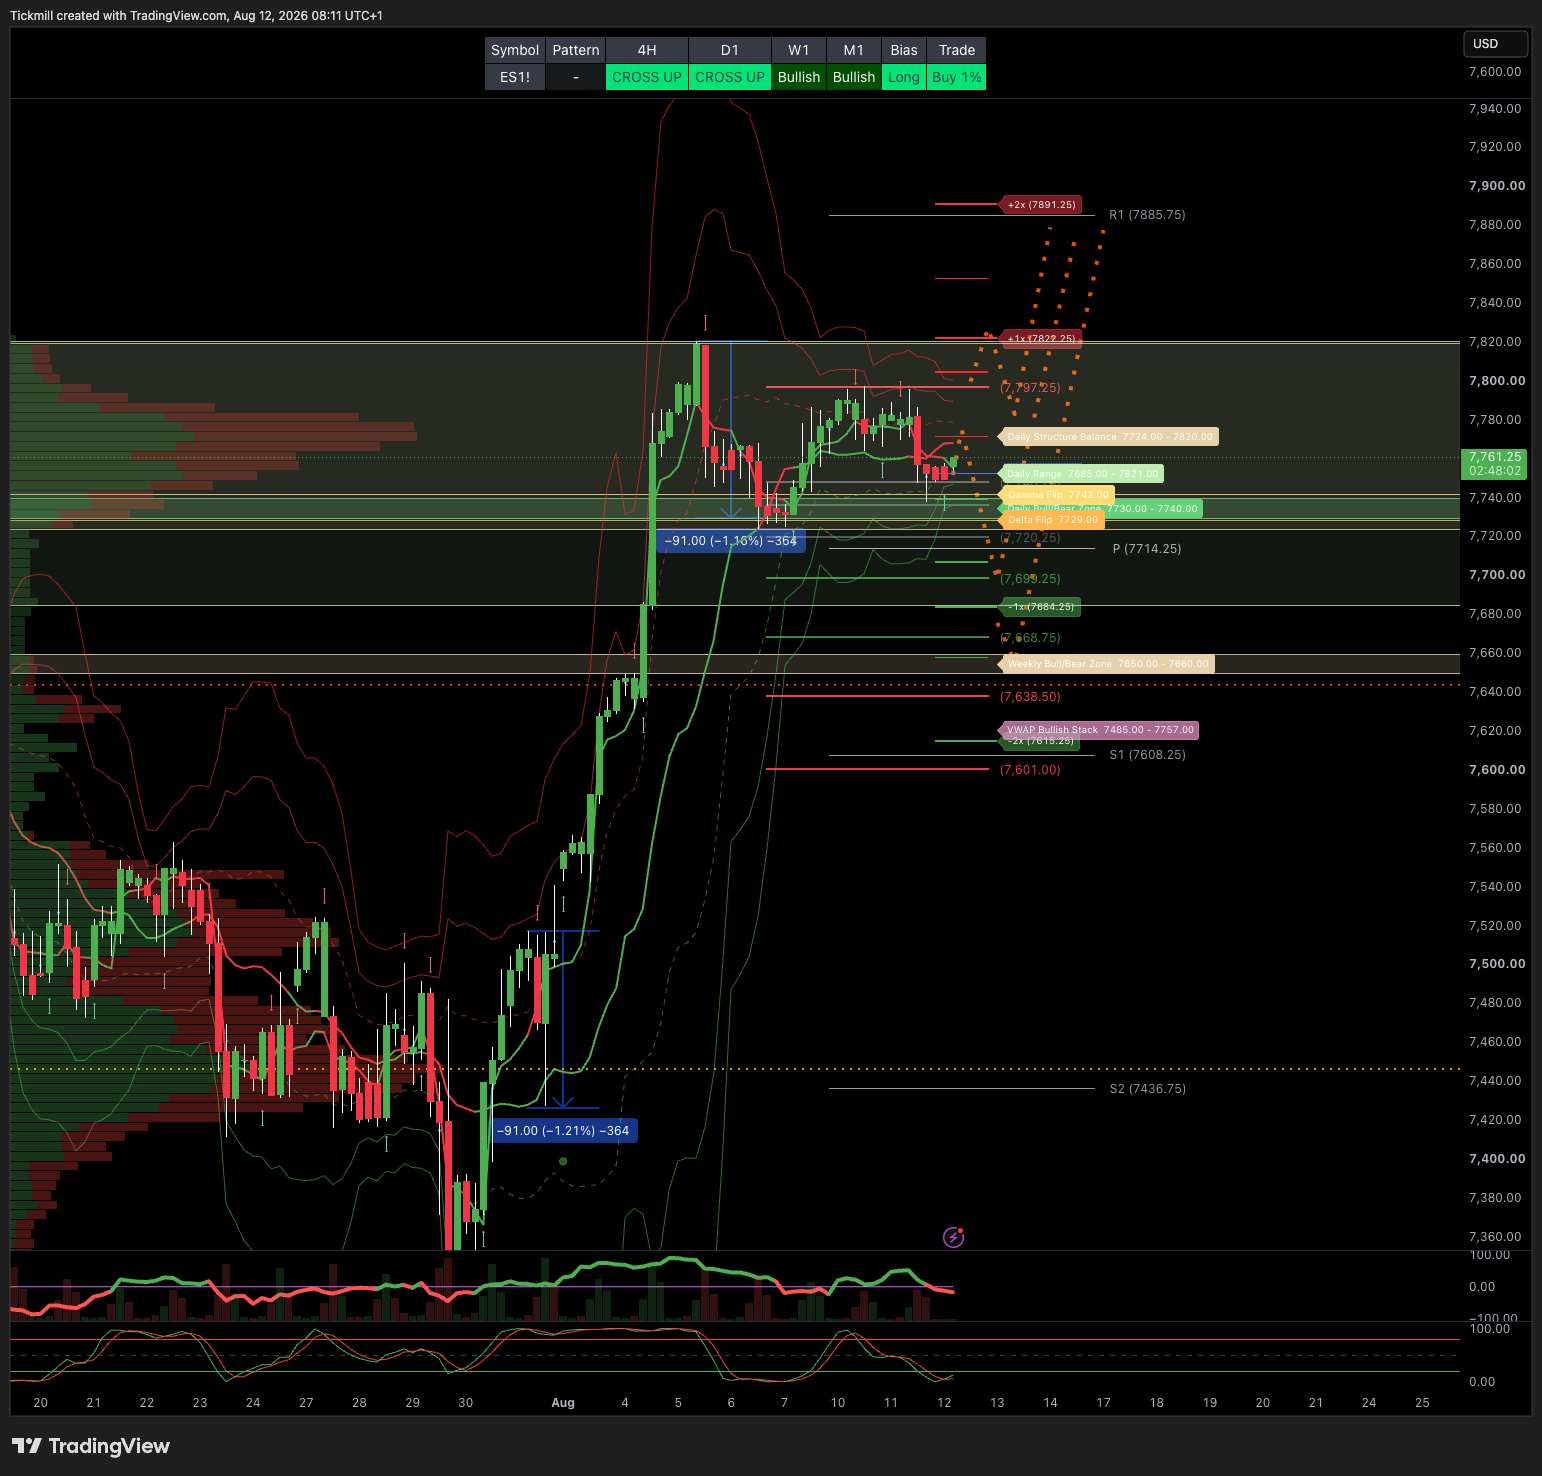
S&P500 Daily Action Areas & Price Targets 12/8/26
***QUOTING ES1! FOR CASH US500 EQUIVALENT LEVELS, SUBTRACT POINT DIFFERENCE***
WEEKLY BULL BEAR ZONE 7660/50
WEEKLY RANGE RES 7880 SUP 7655
MONTHLY RANGE RES 7838 SUP 7258
JHEQX Q3 Collar Short Call Cap: ~7,750 – 7,900 - Long Put Strike: ~7,050 – 7,100 (approx. 5% downside protection) Short Put Strike: ~5,950
DEC2025 OPEX to DEC2026 OPEX is 945 points giving us a range of [5889,7779]
SPX PUT/CALL RATIO 1.13 (The numbers reflect options traded during the current session.) A put-call ratio below 0.7 is generally considered bullish, and a put-call ratio above 1.0 is generally considered bearish.
GS Flow Desk: large S&P 31Aug 7000/7950 strangle in roughly $20mm vega / $115mm premium …My Read – classic “big convexity versus carry” trade: either someone paid a lot to own a wide August move, or someone got paid a lot to bet that the S&P stays comfortably inside the 7000–7950 corridor
DAILY VWAP BULLISH 7757
WEEKLY VWAP BULLISH 7562
MONTHLY VWAP BULLISH 7485
DAILY STRUCTURE - BALANCE - 7820/7724
WEEKLY STRUCTURE - OTFH - 7542
MONTHLY STRUCTURE - OTFH - 7345.75
Balance: This refers to a market condition where prices move within a defined range, reflecting uncertainty as participants await further market-generated information. Our approach to balance includes favouring fade trades at the range extremes (highs/lows) while preparing for potential breakout scenarios if the balance shifts.
One-Time Framing Higher (OTFH): This represents a market trend where each successive bar forms a higher low, signalling a strong and consistent upward movement.
One-Time Framing Lower (OTFL): This describes a market trend where each successive bar forms a lower high, indicating a pronounced and steady downward movement.
DAILY BULL BEAR ZONE 7740/30
GAMMA FLIP 7742
DELTA FLIP 7729
DAILY RANGE RES 7821 SUP 7685
2 SIGMA RES 7889 SUP 7617
VIX BULL BEAR ZONE 17.9 (VVIX / VIX) 6.01
TRADES & TARGETS
LONG ON REJECT/RECLAIM DAILY BULL BEAR ZONE TARGET DAILY RANGE RES
***ADDITIONAL SETUPS & TARGETS HIGHLIGHTED ON THE CHARTS***
(I FADE TESTS OF 2 SIGMA LEVELS ESPECIALLY INTO THE FINAL HOUR OF THE NY CASH SESSION AS 90% OF THE TIME WHEN TESTED THE MARKET WILL CLOSE ABOVE OR BELOW THESE LEVELS)
GOLDMAN SACHS FICC & EQUITY TRADING DESK VIEWS
US Close — Quiet Pre-CPI Tape; Small Caps Lead as Yields Ease; AI Financing Narrative Supports Semis
The market was largely unchanged into tomorrow’s CPI print, with overall activity levels very light. The S&P 500 closed down 32bps at 7,728, while NDX fell 33bps to 29,525. Small caps were the clear relative outperformer, with the Russell 2000 up 36bps to 3,028, helped by slightly easier yields.
The headline tape was quiet, but the underlying message was important:
Investors are waiting for CPI, realized volatility remains muted, small caps are responding to lower yields, and Nvidia’s US$500bn financing partnership announcement reinforces the AI capital-formation / compute-financing theme.
1. Market Snapshot
Asset | Move | Close |
|---|---|---|
S&P 500 | -32bps | 7,728 |
NDX | -33bps | 29,525 |
Russell 2000 | +36bps | 3,028 |
Dow | -34bps | 53,791 |
VIX | -103bps | 15.3 |
WTI crude | +156bps | US$83.41 |
US 10Y yield | -1.6bps | 4.6904% |
Gold | -49bps | US$4,369 |
DXY | flat | 99.81 |
Bitcoin | -84bps | US$63,571 |
Volume remained light:
14.909bn shares traded across US equity exchanges
versus 19.251bn YTD daily average
That means activity was roughly:
14.90919.251≈77.4%19.25114.909≈77.4%
of the YTD daily average.
Market-on-close imbalance:
US$3.7bn to sell
Despite that, price action was orderly, reinforcing the low-activity / low-realized-volatility backdrop.
2. Macro Setup: Waiting for CPI
The market had very little news to trade ahead of the July CPI print.
Consensus / forecast:
CPI Metric | Forecast |
|---|---|
July core CPI, GIR | +19bps MoM |
Consensus | +20bps MoM |
The difference is small, but the setup matters because:
positioning has re-risked after last week’s de-risking
CTA equity sell triggers are now further away
Treasury CTAs remain short
SPX implied move through tomorrow’s close is only 0.59%
small-cap event pricing looks especially compressed
So CPI is being priced as a relatively contained event, even though cross-asset positioning leaves room for a larger reaction if the print surprises.
3. Small Caps Outperform as Yields Ease
The Russell 2000 gained 36bps, outperforming large-cap indices.
The driver was likely easing yields:
US 10Y yield down roughly 1.6bps
rate-sensitive small caps benefited
RUT / IWM remain highly exposed to financing conditions
This fits the derivatives desk’s point:
Small caps’ beta to rates should be higher after the RUT index rebalance, and IWM event vol looks cheap.
The desk notes that the IWM straddle is already implying the lowest event move since September 2023.
That creates a tactical case for owning small-cap gamma into CPI / retail sales / PPI-type catalysts.
4. AI Complex / Semis Modestly Higher on Nvidia Financing Partnerships
The AI complex and semis were modestly higher after Nvidia announced US$500bn financing partnerships.
This directly reinforces the theme we discussed earlier:
Nvidia is not only the dominant AI infrastructure supplier; it is increasingly becoming a financing anchor for the compute ecosystem.
Bullish interpretation:
validates compute demand
accelerates infrastructure buildout
supports customer financing
expands addressable market
strengthens Nvidia ecosystem lock-in
creates more AI capex visibility
Bearish / reflexive interpretation:
vendor financing blurs organic vs financed demand
increases circularity concerns
ties supplier revenue to customer financing availability
expands exposure to compute asset depreciation risk
reinforces the policy / financing-driven AI capex cycle
In today’s tape, the market leaned modestly positive on the news, but the broader AI / NDX move was not especially strong.
NDX still closed down 33bps, suggesting the headline supported semis but did not create a broad Tech risk-on session.
5. Alternative Asset Managers Lead
Alternative asset managers were the top-performing group:
GSFINALT +449bps
This is notable because it connects directly to the AI financing theme.
The investment case is improving on:
stabilizing revisions
compelling multiples
intact fundamentals
record fundraising
reaccelerating wealth flows
peak credit outflows
growing AI financing leverage
Top picks highlighted:
TPG
STEP
CG
HLNE
KKR
The key idea:
If AI compute becomes a new infrastructure / private-credit asset class, alternative asset managers become major beneficiaries.
They can provide:
private credit
infrastructure debt
data-center financing
GP-led vehicles
wealth-channel access
customized financing structures
equity / credit hybrid capital
So the alt-manager rally is not separate from AI. It is another expression of the AI financing cycle.
6. China ADR Weakness
China ADRs were weak:
GSCBCCAI -288bps
Conversations pointed toward:
source-of-funds trading
rotation back into Korea
Taiwan
Japan
This fits the CTA / regional flow narrative:
Asian equity buying has been focused in Japan, Korea, Taiwan
APAC AI / semiconductor exposure has been a preferred re-risking channel
China ADRs may be used as a funding source for cleaner AI / export / semiconductor exposure elsewhere in Asia
The relative trade appears to be:
Sell China ADRs→Buy Korea / Taiwan / JapanSell China ADRs→Buy Korea / Taiwan / Japan
That is consistent with the broader preference for AI-linked North Asia over China platform / consumer / policy-sensitive exposure.
7. Activity Levels Were Very Low
The floor was:
3 out of 10 in activity
With:
long-only skew benign
hedge-fund skew benign
This is a classic pre-event summer tape:
low conviction
low volume
low realized vol
modest de-risking in indices
selective sector moves
little forced flow
event risk compressed
The market is not heavily leaning one way into CPI, at least in flow terms.
8. Derivatives: S&P Fails to Realize the Daily Straddle
The S&P failed to realize the daily straddle going into the session.
As spot drifted lower in the afternoon:
volatility also moved lower
fixed-strike vols declined
front-end vol softened
That means there was no meaningful demand for downside protection despite the pre-CPI setup.
The spot-vol relationship was normalizing after the prior “spot up / vol up” dynamic.
Today was more like:
Spot Down Slightly+Vol DownSpot Down Slightly+Vol Down
That is consistent with low realized volatility and event premium decay.
9. NDX Vol Underperforms
NDX volatility underperformed alongside spot.
Front-end fixed-strike NDX vols were down:
around 0.80 vol
The NDX-to-SPX vol spread continued to compress, with year-end tenors down:
around 0.25 vol
This is important because it confirms continued fading of Tech-specific optionality.
That aligns with prior points:
average NDX single-stock implied vol has collapsed
investors reduced Tech / AI optionality
NDX futures positioning had turned bearish
AI baskets had lagged non-AI
now NDX vol premium over SPX is compressing further
The market is no longer paying the same premium for NDX convexity.
10. Event Pricing: SPX Implied Move Only 0.59%
The S&P implied move through tomorrow’s close is:
0.59%
That is not especially high given CPI risk.
In index-point terms, using the S&P close of 7,728:
7,728×0.0059≈45.67,728×0.0059≈45.6
So the options market is implying roughly:
±46 S&P points
through tomorrow’s close.
Approximate implied range:
Direction | Level |
|---|---|
Upper implied level | 7,774 |
Lower implied level | 7,682 |
That places the CPI-implied move inside / near the current ES/SPX tactical range rather than pricing a clean break.
11. IWM Event Move Looks Especially Cheap
The desk flags IWM as the more interesting gamma expression.
Reason:
IWM straddle implies the lowest event move since September 2023
small caps should have higher beta to rates after the RUT rebalance
CPI can move yields
yields can disproportionately move small caps
The tactical setup:
If CPI surprises and rates move meaningfully, IWM may realize more than currently implied.
Potential directions:
Soft CPI
yields lower
IWM rallies
small caps outperform
upside gamma pays
Hot CPI
yields higher
IWM sells off
small caps underperform
downside gamma pays
So the attraction is not purely directional. It is the cheapness of event vol relative to rate sensitivity.
12. How This Fits the ES 7724–7800 Range
S&P closed around 7,728, which is near the lower portion of the ES tactical range previously discussed:
range high: 7800
range low: 7724
pivot: 7751
The cash close at 7,728 suggests ES/SPX is still consolidating near range support.
The CPI-implied move of roughly 46 points means CPI can easily test either side of the range:
upside toward 7774 / 7800
downside toward 7682, below the prior range support
So CPI is capable of forcing resolution, but options are not pricing a very large move.
Key tactical levels remain:
Level | Meaning |
|---|---|
7800 | Range high / breakout trigger |
7751 | Pivot |
7724 | Support |
7820 / 7845 / 7893 | Upside breakout targets |
A soft CPI could quickly reclaim 7751, test 7800, and potentially trigger the upside path.
A hot CPI could break 7724 and invalidate the bullish range setup.
13. Cross-Asset Tension Into CPI
The tape has several tensions:
Equity Vol Is Calm
VIX at 15.3
SPX implied move only 0.59%
daily straddle not realized
Rates Remain Important
small caps outperformed on lower yields
Treasury CTAs remain short
CPI can trigger short covering or validate shorts
AI Financing Theme Is Growing
Nvidia US$500bn financing partnership headline
alt managers rally
compute financing cycle broadens
Gold Pauses
Gold fell 49bps to US$4,369 despite recent positive CTA / China demand flows, likely consolidating before CPI.
Oil Higher
WTI rose 156bps to US$83.41, keeping inflation sensitivity alive.
14. CPI Reaction Matrix
Soft CPI
Likely market response:
yields lower
Treasury CTA short-covering risk
small caps outperform
IWM gamma realizes
SPX reclaims 7751
ES/SPX tests 7800
possible breakout toward 7820 / 7845
gold resumes rally
USD softens
NDX may squeeze if underpositioned
In-Line CPI
Likely response:
muted index move
vol decay
range persists
ES continues 7724–7800
small caps may hold relative gains
focus shifts to PPI / retail sales / Jackson Hole / NVDA
Hot CPI
Likely response:
yields higher
small caps underperform
IWM downside realizes
SPX breaks 7724
NDX / long-duration Tech pressured
USD firmer
gold may initially weaken
Treasury CTA shorts remain validated
Disclaimer: The material provided is for information purposes only and should not be considered as investment advice. The views, information, or opinions expressed in the text belong solely to the author, and not to the author’s employer, organization, committee or other group or individual or company.
Past performance is not indicative of future results.
High Risk Warning: CFDs are complex instruments and come with a high risk of losing money rapidly due to leverage. 69% and 73% of retail investor accounts lose money when trading CFDs with Tickmill UK Ltd and Tickmill Europe Ltd respectively. You should consider whether you understand how CFDs work and whether you can afford to take the high risk of losing your money.
Futures and Options: Trading futures and options on margin carries a high degree of risk and may result in losses exceeding your initial investment. These products are not suitable for all investors. Ensure you fully understand the risks and take appropriate care to manage your risk.
Patrick has been involved in the financial markets for well over a decade as a self-educated professional trader and money manager. Flitting between the roles of market commentator, analyst and mentor, Patrick has improved the technical skills and psychological stance of literally hundreds of traders – coaching them to become savvy market operators!